Bihar Economic Survey 2019-2020
■ On 24th February 2020, the Bihar Government presented its Economic Survey 2019-20 in the Legislative Assembly. This is the 14th Economic Survey, the first survey was presented in 2006-07.
• Growth with Justice is the vision of the State Government.
■ Socio-Economic Profile of the State
• In 2018-19
the Gross State Domestic Product (GSDP),
of Bihar at current
prices was ₹ 5,57,490 Cr and ₹ 3,94,350
Cr at constant prices with the base year 2011-12.
★• The growth rate
of Bihar’s economy
in 2018-19 was 10.53 % (at constant prices) and 15.01% (at current
prices), which is higher than the growth rate for the
Indian economy.
• The Per Capita
GSDP of Bihar was ₹ 47,541 at current prices and ₹ 33,629 at constant prices.
• The Per capita Net
State Domestic Product (NSDP)
at constant prices (2011-12) in 2018-19 for Bihar is ₹ 30,617.
However, Bihar has the lowest per capita income among the states in India and
it was at only 33.1% of the national
average (Rs. 92,565) in 2018-19.
• As per the 15th Finance Commission recommendation, the share of Bihar in the total shareable resource pool of the centre has increased from 9.67% to 10.06% for the year 2020-21.
• To supplement the growth process, the State Government is working on the ‘Seven Resolves’ (Saat Nishchay) which includes:
- Welfare of youth,
- Women employment,
- Supply of electricity to all households,
- Clean drinking water,
- Road connectivity,
- Toilet facility, and
- Provision of higher technical education.
•To address the challenges to the environment, Bihar Government started its ambitious programme Jal Jeevan Hariyali Abhiyan in 2019-20. This programme brings the focus of the policymaking to the issues consistent with sustainable development. An amount of ₹ 24,524 crores is budgeted to be spent on this scheme in Bihar over the next three years starting from the current fiscal.
■ Contribution of different sectors
• In the year 2018-19, the contribution of different sectors in the Bihar's Economy was:
Primary Sector: 19.7% (Its contribution has come down from 25.8% in 2011-12 to 19.7%)
Secondary Sector: 19.1%
Tertiary Sector: 61.2% (Its contribution has increased compared to 2011-12 level)
 |
| Sectoral Composition of GSVA at Constant Price for different sectors in 2018-19 |
■ Sectoral Growth Rate
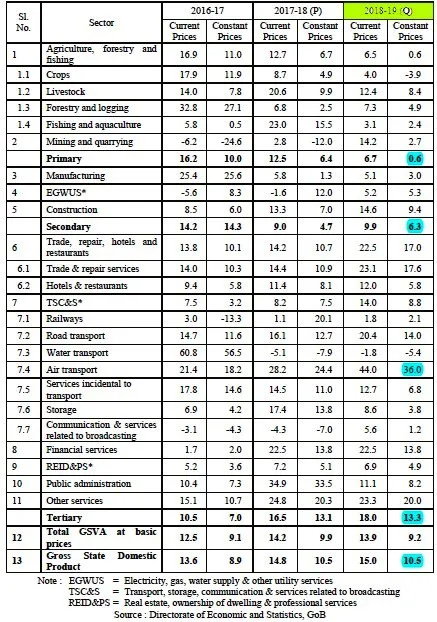
•The Sectoral Growth
Rate of GSDP in Bihar at Constant
Prices were: (Source: CSO)
Primary Sector: 0.6%
Secondary Sector: 6.3%
Tertiary Sector: 13.3%
The overall growth rate for the GSDP in Bihar was estimated to be in double-digit during the last two years (2017-18 & 2018-19). This growth was mainly contributed by the growth in the tertiary sector which grew at 13.3% in 2018-19.
Among the sub-sectors, Air transport registered the highest growth at 36% while Water transport recorded the lowest at -5.4%.
According to the Survey, Air transport, Other Services, Trade and Repair Services, Road Transport and Financial Services are the biggest growth drivers of the economy which have registered double-digit growth.
 |
| Sectoral Growth Rate of GSDP (2016-17 to 2018-19) |
■ District-wise Disparity:
- Patna,
- Munger and
- Begusarai
- Madhepura,
- Supaul and
- Sheohar
In absence of latest figures consumption of Petroleum Products per 1000 persons can give some idea about relative prosperous and backward districts in Bihar.
 |
| Relatively Prosperous and Backward Districts of Bihar |
• The three most prosperous districts in terms of per capita small savings are Patna, Saran and Buxar.
■ Inflation:
The combined inflation has been lowest in Bihar while it was 4.62% for India as a whole.
■ Unemployment
• According to the Periodic Labour Force Survey (July 2017-June 2018), the unemployment rate in Bihar was 7.2% (Rural +Urban), which is higher than that at the all-India level (6.1%).
Few Definitions:
• Labour force participation rate (LFPR): LFPR is defined as the percentage of persons in the labour force in the population.
LFPR= (Labour force/ Total population)*100
• Worker Population Ratio (WPR): WPR defined as the percentage of employed persons in the population.
• Proportion Unemployed (PU): It is defined as the percentage of persons unemployed in the population.
• Unemployment Rate (UR): UR is defined as the percentage of persons unemployed among the persons in the labour force.
UR= (Number of Unemployed person/Labour force)*100
■ Extra link:
The End.


